Statistics - Test Papers
CBSE Test Paper 01
Chapter 14 Statistics
=. (1)
- Mode
- Median
- Mean
- None of these
Construction of cumulative frequency table is useful to determine (1)
- mean
- all the three
- median
- mode
For the following distribution
Class Below 10 Below 20 Below 30 Below 40 Below 50 Below 60 Frequency 3 12 27 57 75 80 the modal class is (1)
- 50 - 60
- 40 - 50
- 20 - 30
- 30 - 40
The mean of the first 10 natural numbers is (1)
- 4.5
- 5
- 6
- 5.5
The marks obtained by 9 students in Mathematics are 59, 46, 30, 23, 27, 44, 52, 40 and 29. The median of the data is (1)
- 35
- 29
- 30
- 40
Find the mode of the given data 3, 3, 7, 4, 5, 3, 5, 6, 8, 9, 5, 3, 5, 3, 6, 9, 7, 4. (1)
If the median of a series exceeds the mean by 3, find by what number the mode exceeds its mean? (1)
If the values of mean and median are 26.4 and 27.2, what will be the value of mode? (1)
In the following frequency distribution, find the median class. (1)
Height (in cm) 140 -145 145-150 150-155 155 -160 160 -165 165 -170 Frequency 5 15 25 30 15 10 Find median of the data, using an empirical relation when it is given that Mode = 12.4 and Mean = 10.5. (1)
Find the mode of the following distribution. (2)
Class interval 0-10 10-20 20-30 30-40 40-50 50-60 60-70 70-80 Frequency 5 8 7 12 28 20 10 10 Convert the following data into 'more than type' distribution: (2)
Class 50 - 55 55 - 60 60 - 65 65 - 70 70 - 75 75 - 80 Frequency 2 8 12 24 38 16 Calculate the mean of the following data, using direct method: (2)
Class 25 - 35 35 - 45 45 - 55 55 - 65 65 - 75 Frequency 6 10 8 12 4 If the median of the following frequency distribution is 46, find the missing frequencies. (3)
Variable 10-20 20-30 30-40 40-50 50-60 60-70 70-80 Total Frequency 12 30 ? 65 ? 25 18 229 Find median for the following data: (3)
Wages(in Rs) Number of workers More than 150 Nil More than 140 12 More than 130 27 More than 120 60 More than 110 105 More than 100 124 More than 90 141 More than 80 150 Draw a pie-chart for the following data of expenditure on various items in a family.
Item Education Food Rent Clothing Others Expenditure (in Rs.) 1600 3200 4000 2400 3200 3Find the mean and mode of the following frequency distribution: (3)
Classes 0 - 10 10 -20 20 -30 30 -40 40 -50 50 -60 60 -70 Frequency 3 8 10 15 7 4 3 From the following frequency distribution, prepare the 'more than' ogive. (4)
Score Number of candidates 400 - 450 20 450 - 500 35 500 - 550 40 550 - 600 32 600 - 650 24 650 - 700 27 700 - 750 18 750 - 800 34 Total 230 Also, find the median.
Find the mean marks of students from the following cumulative frequency distribution: (4)
Marks Number of students 0 and above 80 10 and above 77 20 and above 72 30 and above 65 40 and above 55 50 and above 43 60 and above 28 70 and above 16 80 and above 10 90 and above 8 100 and above 0 The marks obtained by 100 students of a class in an examination are given below:
Marks Number of students 0 - 5 2 5 - 10 5 10 - 15 6 15 - 20 8 20 - 25 10 25 - 30 25 30 - 35 20 35 - 40 18 40 - 45 4 45 - 50 2 Draw cumulative frequency curves by using (i) 'less than' series and (ii) 'more than' series.
Hence, find the median. (4)
CBSE Test Paper 01
Chapter 14 Statistics
Solution
- Median
Explanation: Since, 3 Median = Mode + 2 Mean
Median =
Median =
Median =
- Median
- median
Explanation: A cumulative frequency distribution is the sum of the class and all classes below it in a frequency distribution. Construction of cumulative frequency table is useful to determine Median.
- median
- 30 – 40
Explanation: According to the question,
Here Maximum frequency is 30.Class 0 – 10 10 – 20 20 – 30 30 – 40 40 – 50 50 – 60 Freq 3 9 15 30 18 5
Therefore, the modal class is 30 – 40.
- 30 – 40
- 5.5
Explanation: The first 10 natural numbers are 1, 2, 3, …………, 10
Mean =
=
= = 5.5
- 5.5
- 40
Explanation: Arranging the given data in ascending order: 23, 27, 29, 30, 40, 44, 46, 52, 59
Here n = 9, which is even.
Median =
=
= 5th term = 40
- 40
We observe that the value 3 has the maximum frequency i.e 5 .Value x 3 4 5 6 7 8 9 Frequency f 5 2 4 2 2 1 2
The mode of data is 3.Given,
Since,
Mode = Mean + 9
Hence Mode exceeds Mean by 9.We know that
Mode = 3 median -2 mean
= 3(27.2) - 2(26.4)
= 81.6 - 52.8 = 28.8
Mode = 28.8Height Frequency c.f. f = 100
th term = = 50th term
Hence, Median class is 155 - 160.Mode = 3 median - 2 mean
Mode = and mean =
Median = Mode + Mean
= (12.4) + (10.5)
So, median is 11.13.
Here the maximum frequency is 28 then the corresponding class 40 - 52 is the modal classClass interval 0-10 10-20 20-30 30-40 40-50 50-60 60-70 70-80 Frequency 5 8 7 12 28 20 10 10
l = 40, h = 50 - 40 = 10, f = 28, f1 = 12, f2 = 20
Mode
= 40 + 6.67
= 46.67Class Frequency Cumulative Frequency More than 50 2 98 + 2 = 100 More than 55 8 90 + 8 = 98 More than 60 12 78 + 12 = 90 More than 65 24 54 + 24 = 78 More than 70 38 16 + 38 = 54 More than 75 16 16
from table ,Class Interval Frequency Class mark 25 - 35 6 30 180 35 - 45 10 40 400 45 - 55 8 50 400 55 - 65 12 60 720 65 - 75 4 70 280
,
we know that,
mean =Let the frequency of the class 30 - 40 be f1 and that of the class 50 - 60 be f2. The total frequency is 229.
12 + 30 + f1 + 65 + f2 + 25 + 18 =229
f1 + f2 =79
It is given that the median is 46
Clearly, 46 lies in the class 40 - 50. So, 40 - 50 is the median class.
and
N=229
Since ,
=45
Hence, f1 = 34 and f2 =45C.I. f c.f. 80 - 90 9 9 90 - 100 17 26 100 - 110 19 45 110 - 120 45 90 120 - 130 33 123 130 - 140 15 138 140 - 150 12 150
Median Class
we know that, Median =Item Expenditure (Ei) Central angle = Education 1600 Food 3200 Rent 4000 Clothing 2400 Others 3200 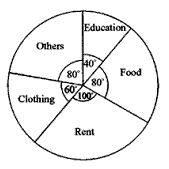
Mean =Class interval 5 3 15 8 25 10 35 15 45 7 55 4 65 3
Mean = 32.8
For Mode, Modal class = 30 - 40
and
Mode =
=
=
=
=
Mean of given data is 32.8 and mode is 33.85.- More than series:
plot the points (400, 230), (450, 210), (500, 175), (550, 135), (600, 103), (650, 79), (700, 52), (750, 34).Score Number of candidates More than 400 230 More than 450 210 More than 500 175 More than 550 135 More than 600 103 More than 650 79 More than 700 52 More than 750 34 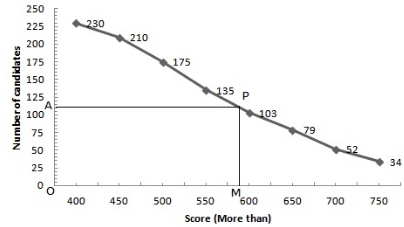
Take a point A(0, 115) on the y-axis and draw AP||x-axis meeting the curve at P, Draw PM x-axis intersecting x-axis at M
Hence, median - Here we have, the cumulative frequency distribution.
So, first we convert it into an ordinary frequency distribution.
We observe that there are 80 students getting marks greater than or equal to 0 and 77 students have secured 10 and more marks.
Therefore, the number of students getting marks between 0 and 10 is 80 - 77 = 3.
Similarly, the number of students getting marks between 10 and 20 is 77 - 72 = 5 and so on.
Let assumed mean (a) = 55.Marks Mid-value (xi) Frequency (fi) fiui 0-10 5 3 -5 -15 10-20 15 5 -4 -20 20-30 25 7 -3 -21 30-40 35 10 -2 -20 40-50 45 12 -1 -12 50-60 55 15 0 0 60-70 65 12 1 12 70-80 75 6 2 12 80-90 85 2 3 6 90-100 95 8 4 32 Total
We have,
a = 55 and h = 10
Therefore, the mean number of marks is - Less than series:
Plot the points (5, 2), (10, 7), (15, 13), (20, 21), (25, 31), (30, 56), (35, 76), (40, 94), (45, 98) and (50, 100).Marks Number of students Less than 5 2 Less than 10 7 Less than 15 13 Less than 20 21 Less than 25 31 Less than 30 56 Less than 35 76 Less than 40 94 Less than 45 98 Less than 50 100
Join these points free hand to get the "less than" cumulative curve. - 'more than' series:
Now, on the same graph paper as above, we plot the point (0, 100), (5, 98), (10, 93), (15, 87), (20, 79), (25, 69), (30, 44), (35, 24) , (40, 6) and (45, 2)Marks Number of students More than 45 2 More than 40 6 More than 35 24 More than 30 44 More than 25 69 More than 20 79 More than 15 87 More than 10 93 More than 5 98 More than 0 100 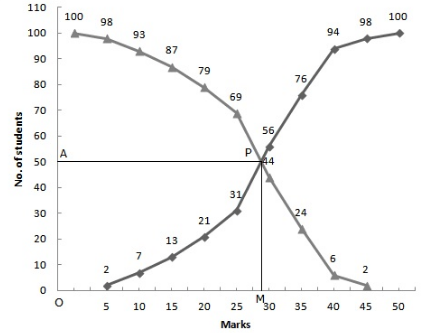
N = 100
Two curves intersect at Point P(28, 50)
Hence, median = 28
- Less than series: